Reviewed: Top 10 Business Intelligence Software Platforms
When it starts to snow, you take notice. After all, each falling flake looks special at the start of a snowstorm. But then what happens? The flakes clump together. They no longer stand out. If it’s really coming down, snow piles build up and blot out the roadways.
Same thing happens with data: what was visible and measurable in small quantities is quickly lost at scale. Marketers know how hard it is to track granular information for prospects and users through ever-increasing heaps of data.
Looking at the right slice of data is like finding one flake in a fresh snowstorm. Our customers, touchpoints, and data sets are composed of unique and individual interactions, and they’re nearly impossible to track once they’re lumped in with the rest.
Business intelligence software platforms allow us to make sense of huge volumes of data. And from all that nondescript data comes something meaningful. BI solutions assemble all the discrete data for analysis, then group and shape them for use.
Whether it’s a picture of your users, business trends, or a workable market storyline, business intelligence tools are the best way to makes sense of and derive actionable insight from structured and unstructured data sets.
But what types of business intelligence software should you invest your time and money with?
Today, we’re going to review the top 10 business intelligence tools. Whether you’re using data scientists or need self-service dashboards that are ready to go, read on to get the lowdown on the most effective software solutions in the space.
Better yet, we’ll be referencing user testimonials to provide the cold, hard facts about these technologies. So you don’t waste time and money on costly demos. Or catch a cold from being buried under all that data.
#1 Tableau

(Source)
Flexible with a large collection of data connectors and visualizations, Tableau showcases an intuitively designed dashboard that’s accessible to any industry. This self-service business intelligence tool makes short work of large data sets, provides custom visualizations, and flashy reports.
Customer support is live and there’s on-demand training is available. Which is needed as the learning curve on both the desktop and web-based suite can be steep. But once you’ve conquered the steepness of Tableau, you'll be surprised at what your data can tell about your business. So if you’re looking to take a deep dive into complex data sets in a way that’s easy to comprehend, Tableau is definitely worth checking out. Just don't forget your scuba gear!
Overall, Tableau supports a berth of data types, provides quick insights, and facilitates easy report sharing. It’s an industry leader.
What do you like best?
“Tableau is a fantastic visualization tool, with a wide depth of personalization options, basic data functionality, and the capability to make all sorts of useful calculations.
What do you dislike?
Some data connectors, like the Salesforce connector could be better, allowing for SOQL queries would be a big plus. I've always had to do data building, cleaning, and customization pre-Tableau, which makes this not a "full-stack" solution.
Recommendations to others considering the product
Tableau Desktop is a great tool for making data visualizations and customizing the data exploration process for users. While it is not what I would consider a full stack BI tool, since it lacks some data joining and prepping capabilities, it is fantastic for exploring and visualizing standardized data sets. Building and customizing dashboards is quick through Tableau's best practices that are automatically used by just double clicking the data you want to see. It is an intuitive and highly flexible tool with a great community and a responsive support team.” -- Joe R., Marketing Intelligence at Cradlepoint Inc. via G2Crowd
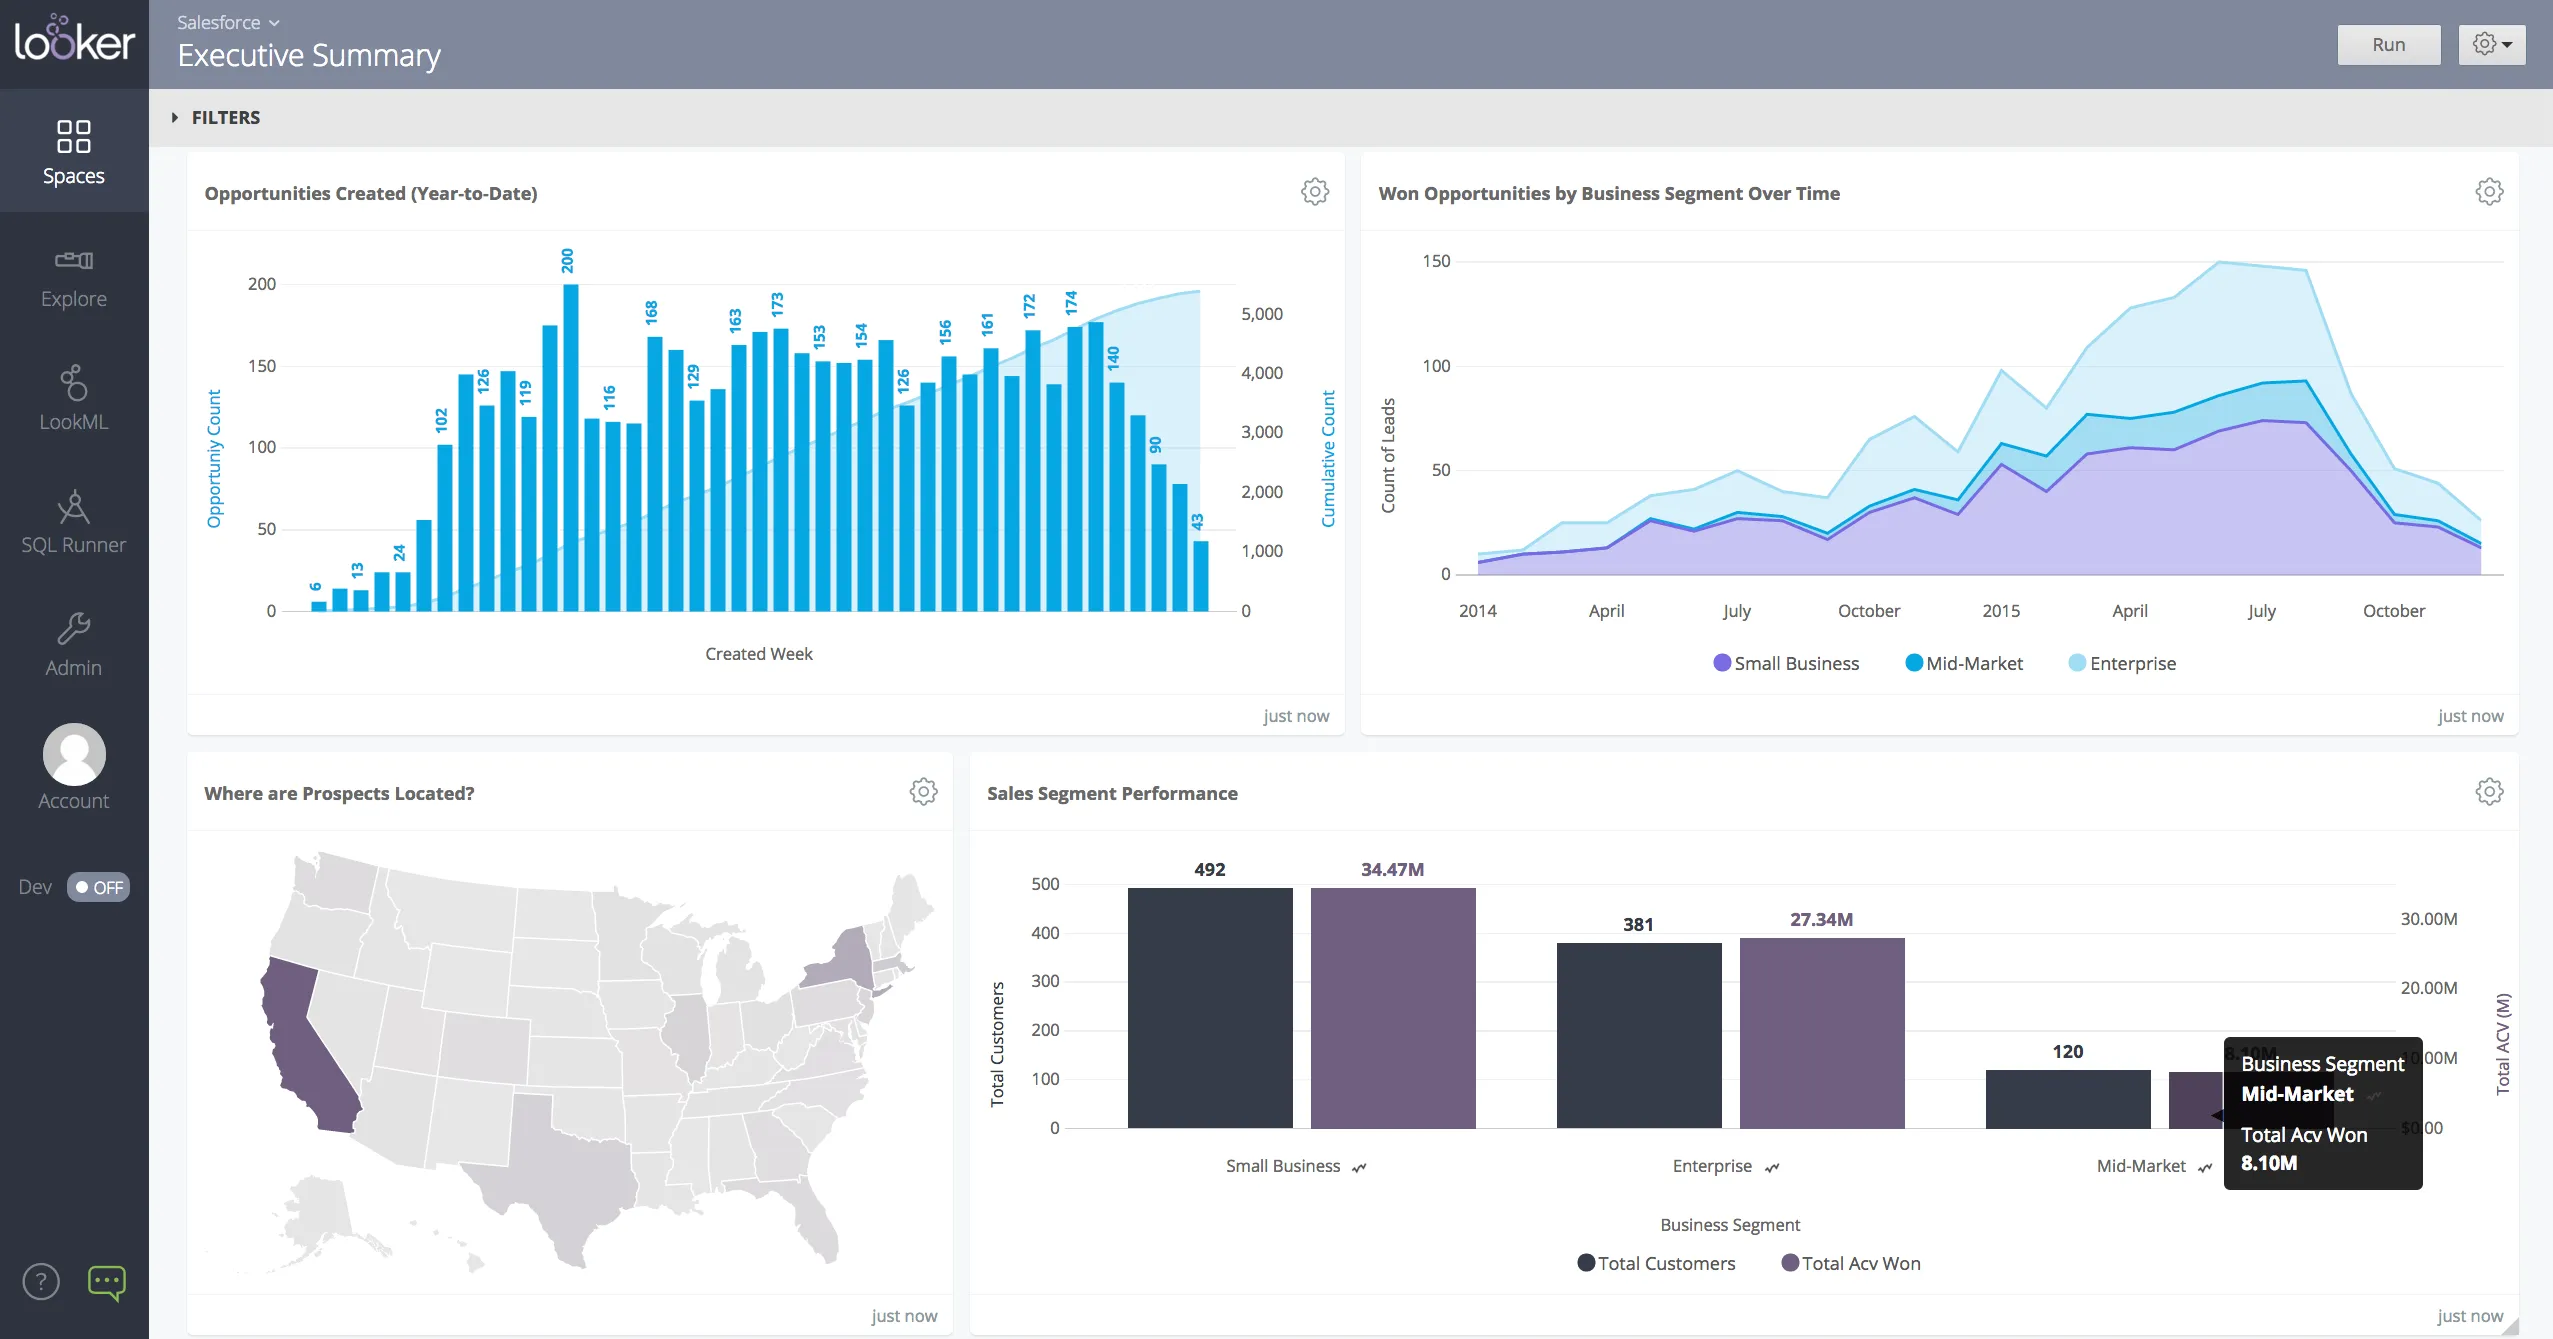
#2 Looker
(Source)
Looker makes web-based business intelligence ready to anyone familiar with a web browser. Easy to use dashboards allow for customizable charts, graphs, and reports.
Query and drill into SQL models to find insights into customer behavior, analyze supply chains, calculate customer value, and more. In the end, modeling and transformations allow this data exploration tool to bring you data analytics that assists with every aspect of business operations.
In short, Looker is the perfect tool for the modern data scientist. So go ahead and look at Looker – you may never need another BI tool again!
Don’t worry if you have no idea what “data science” means. With Looker, you don’t need to be a data scientist to get the insights you need for your business. It’s intuitive interface and easy-to-use features make it a great choice for anyone looking to gain insight from their data. So don’t worry, Looker has got you covered! Get ready to explore all your data with Looker – it’s time to get your business intelligence in gear!
“When focus is on understanding, playing, discovery and standard reporting needs, Looker is a very interesting tool to use. When done right, you can go up and down, back and forth in your data, link different "looks" or dashboards together and very interestingly, you can define what happens (i.e. is shown) when users drill down on a certain metric.
With teams of analysts in place, a shared LookML, version controlled repository will help to keep data models right and in sync - no more 20 different versions of an Excel file or such. After all, the Looker UI is very simple to use, simpler than Excel, Tableau, Qlik etc.
Looker Pros
- Interesting approach to data modelling (LookML), that highly increases re-usability, is version controlled and much easier to understand for people that are not fluent in SQL.
- Makes data discovery fun and easy.
- Collaboration features
Looker Cons
- Visualisation capabilities clearly lack behind Tableau and some others.
- Allow for custom branding and CSS changes to fit a given corporate identity / design
- Ability to blend data between different sources (i.e. two different connections / databases).”-- Christian Lubasch, Managing Director at LeROI Digital Analytics & Marketing, via TrustRadius
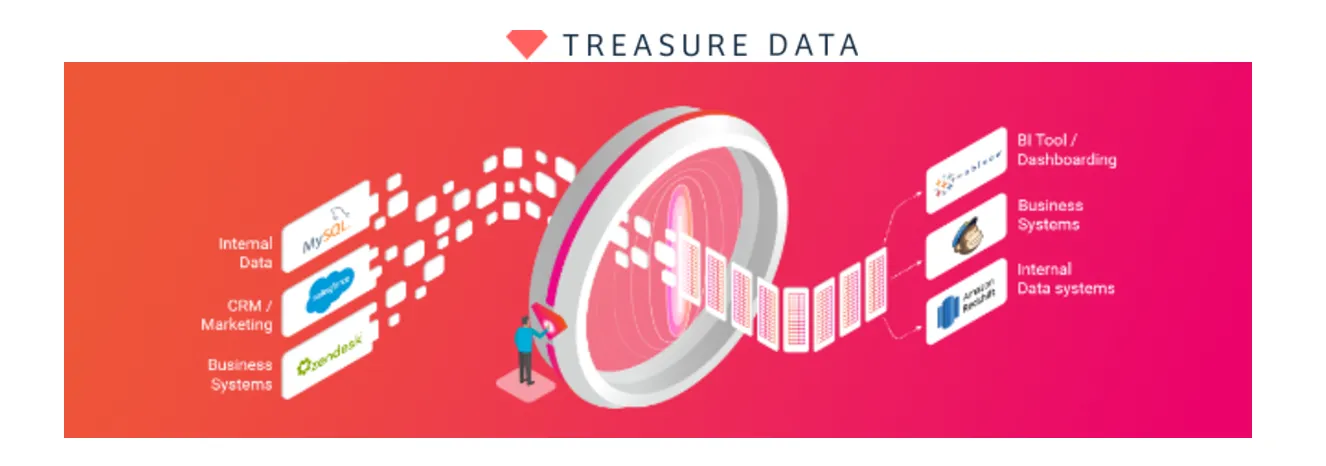
#3 Treasure Data
(Source)
Treasure Data is an analytics solution that connects historical and streaming cross-platform data into real-time insights. Get hourly reports, ad hoc analytics, and view customizable dashboards from anywhere. This big data infrastructure takes from the Hadoop model, allowing you to upload infinite data.
Data is exportable with drag and drop analysis, queryable via SQLs and JDBC for real-time analysis, and integrates with Tableau, Excel and others to provide visualizations. Use this business intelligence software to get granular insights into customers, operations, and products. Define custom goals, view explicit data correlations, and pursue the right metrics with Treasure Data’s pinpoint analysis.
Get an enterprise wide view of your entire information ecosystem and mine insights that will inform decisions to drive better performance.
With Treasure Data, you can finally sight the treasure trove of data in your business. Accessible from any device – now you'll be able to take a deep dive into the inner-workings of your organization. The possibilities are endless! So, what are you waiting for? Start exploring the depths of your data with Treasure Data.
“We just send the data to Treasure Data, aggregate it in the cloud and export it when we need it. It’s simple.” -- Erik Hulbosch, Product Manager at Just Premium Marketing, via FeaturedCustomers
“Time is the most precious asset in our fast-moving business, and Treasure Data saved us a lot of it.” -- Julian Zehetmayr, CEO at MOBFOX Advertising, via FeaturedCustomers
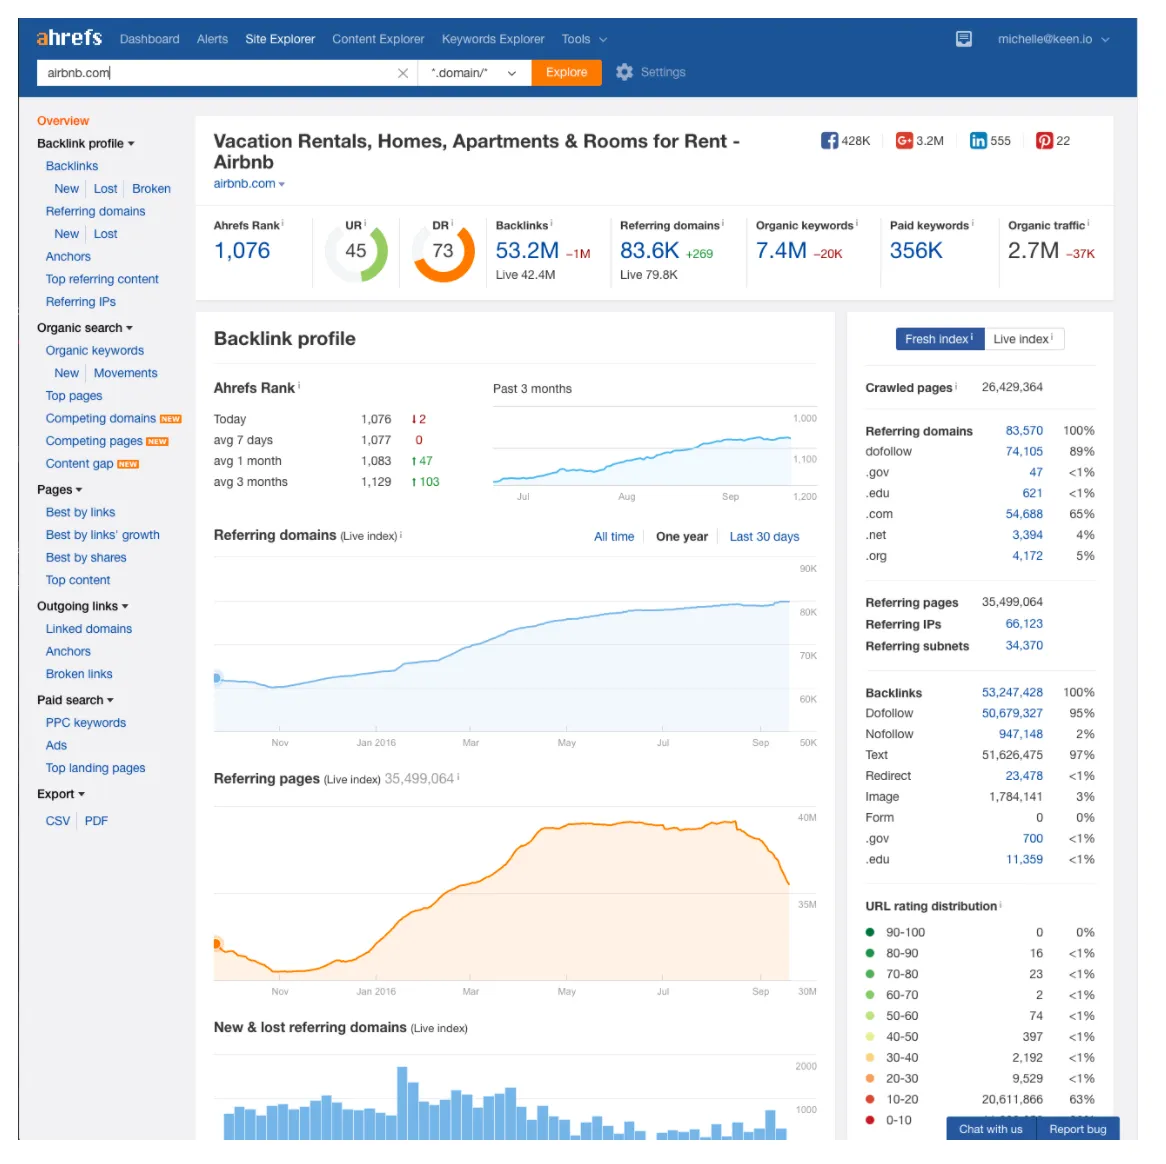
#4 Keen. IO
(Source)
Keen makes your data collection process easy, delivering data to cloud-based data storage for quick and easy storage from most platforms or devices. Analyze data and then review and customize reports from anywhere, anytime.
Share auto-update visuals with customers on website dashboards. Export this data to do further analysis as you please. Integrate with Slack and other productivity software solutions to keep data flexible.
Create custom tags to keep track of individual events and objects. Create data pipelines for automated, real-time analysis of your collected data. Keen makes the process a breeze!
Plus, you don't have to be a tech wizard to get started - just sign up and start collecting your data today. And with their 24/7 customer support, you can always count on them to answer your questions and provide the support you need.
What do you like best?
“The service does do a good job at being able to track usage and customize events that are being sent to it. It is also really good at being able to access that data.”
What do you dislike?
“The "Explore data" feature is very nice to be able to get a quick view of the data, but it would be much more helpful if you could also export the data in a much more viewable way. Unfortunately when you do try to use the export on the data explorer, it messes up the formatting pretty bad making it very difficult to use in a useful way.” -- User, via G2Crowd
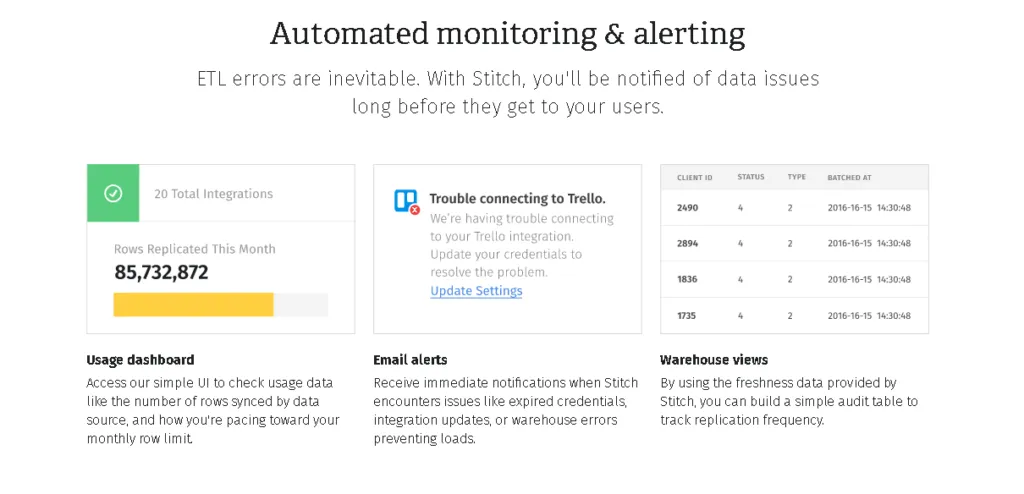
#5 Stitch Data
(Source)
Stitch is a straightforward, potent ETL service built for developers who need to consolidate data from one database to the next. Essentially, it connects your data sources through one simplified user interface that coordinates data pipelines into usable materials.
In order to communicate key information between programs, Stitch scales to billions of events and grows with data volume. It allows you to choose the frequency of replications and updates for data selection that informs certain tables, fields, endpoint. Integrate from your data warehouse and boom - data mobility achieved!
“With Stitch, we were able to get our data streaming to our warehouse in minutes; and it requires zero engineering maintenance.” -- Matt Kent, Head Engineer at Sprig App, via Stitch
“Stitch has played an instrumental role in channelizing our data from various marketing channels into our central warehouse. We find them agile & customer-centric in their approach.” -- Saranya Babu, VP of Marketing at Instapage, via Stitch
#6 Periscope
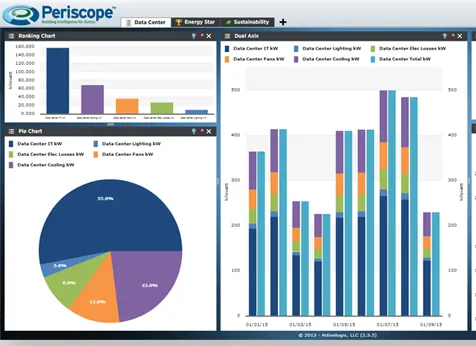
(Source)
Periscope is an SQL tool built for data analysts who want the fastest queries, sharing, and workflows. Connect your database to the dashboard, input the SQL, and receive a chart as easy as one, two, three.
The Periscope cache system fetches queries up to 150x faster than other business intelligence solutions. Dashboards are unlimited and embeddable with a smidgen of code. Custom visualizations, easy exporting, and fast-acting analysis make Periscope a quick and easy choice for the savvy tech user.
If you’re looking for a way to get an eagle-eye view of your data, Periscope is here to swoop in and save the day. With it, you can keep tabs on your business with up-to-date insights and spot trends in no time. Get the answers to your questions faster than ever before and make data-driven decisions with confidence.
What do you like best?
“We can spin up dashboards for every part of our business, making us the most metrics-driven company in our industry. Incredibly powerful to be able to visualize all data about every transaction we ever manage on our platform.
Because it's so easy to make these dashboards, we actually do a lot of our work like managing checklists for compliance, reviewing sales pipelines, tracking quota progress, etc right in Periscope. Super easy to pipe salesforce data in as well to manage our own data coming out of our app.
Recommendations to others considering the product
It's better (more flexible, faster, more powerful) and cheaper than Looker, Tableau, Domo, or any competing product.”-- Ryan P., CEO at FlexPort Logistics and Supply, via G2Crowd
#7 Domo
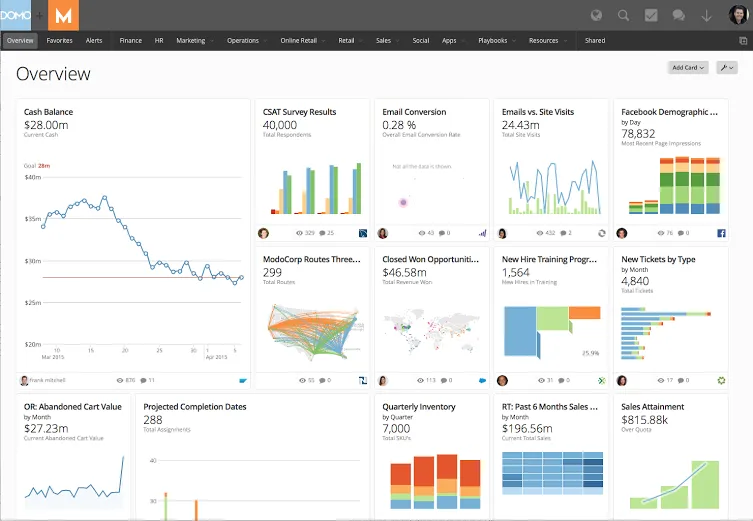
(Source)
As a cloud-based business intelligence platform, Domo offers interactive visualization tools and easy access to your data through custom dashboards. Gather data sets to find clarity in real-time for KPIs and insights. Integrate with spreadsheet, databases, and social media. The wide set of data connectors and sharing options makes Domo a clear favorite, even if the SQL commands can be a bit tricky.
Domo is about getting organized and making sense of the numbers. So if you're looking for an easy way to crunch data and keep your business running smoothly, Domo's the perfect companion!
What do you like best?
“The build process makes it easy to find the most insightful easy to interpret way to display the data. Once you have found your preferred delivery method, you always have that reference any time the business question repeats itself.
It also helps that the design is well done which allows you to take the data right out of Domo and display in other formats as needed (powerpoint, paper reports, etc.).”
What do you dislike?
“I have found Domo support time to be lacking on multiple occasions, luckily we don't need it often. Learning the nuances of the tool are difficult to worth through as there is no strong onboarding or initial training.” -- Tucker S., Business Development & Digital Strategy at Adduco Media and Marketing, via G2Crowd
What do you like best?
“It has given visibility across departments and streamlined intelligence operations for our executive team. Teams know where to report their data and how to make data reach the eyes of decision makers. Both stakeholders and executives can quickly and easily create data like they like it.
I love Domo's ability to pull in information from any data source. Virtually any data source can be pulled into Domo and the represented as a chart or table. From there, Domo's ability to marry data from disparate sources is its strongest tool.”
What do you dislike?
“Data transformations and merges can be tricky.
At times, users can be at the mercy of pre-made templates and connectors. EG, QuickBooks' connectors and reports are thin, and there is no way to improve them without help from QB (who won't help).” -- Patrick S., Business Analyst at Hixme Insurance Tech via G2Crowd
#8 Dundas Business Intelligence
(Source)
Dundas BI is a web-based data analysis and visualization platform with a rich set of features. A custom BI platform provides real-time data access how you want it, letting you transform dashboards and reports into insights. It integrates with your systems, runs ad hoc queries, builds out reports, and offers a great reporting tool. Work with data insights on anything from a desktop to a smartphone.
The Dundas BI platform is simple to use. Automate manual processes and create data visualization dashboards with drag-and-drop functionality. Create professional reports with ease using the intuitive interface, plus access a library of templates for quick results.
With security features such as role-based user profiles, you can make sure everyone in your organization is always in the know.
“We have chosen Dundas BI because of its flexibility and the ability to integrate with wide range of data sources, the open API platform that allows to do non-traditional integrations with our in-house systems. Dundas support team are always on time to solve any issues or to provide any suggestions and java scripts to help our issues.
Pros: Flexibility to do whatever you want, Open API and known scripting languages like HTML5 and JS where 99% of your word can be accomplished through drag and drop including preparing the connections to database, you can do all the task which usually have to be done through SQL language by using Dundas and only drag and drop like join, sort , filter, union, aggregation and more.” -- Mohammad Qasim, Professional Services Manager at Infocloud IT Services, via Capterra
“Cons: the terminology can be pretty difficult sometimes to understand. Other than that, some of their features have minor glitches which I‘m sure they are in the process in fixing as their customer support is tremendous.” -- Jeremy Burke, Data Analyst at NB Power Utilities, via Capterra
#9 Microsoft SharePoint
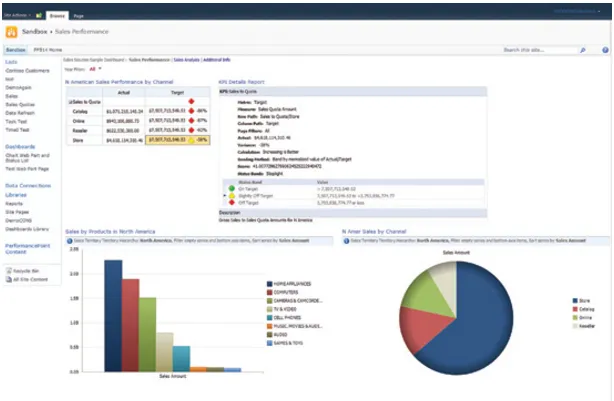
(Source)
Microsoft SharePoint is a web-based or on-site business intelligence solution that helps companies collect, organize, and analyze data. It pairs well with other Microsoft suite products for an enhanced user experience.
Use it to manage documents, publish reports, and work in collaborative ways with interactive dashboards. Tools include a website builder, partner extranet, customer portal, and model. Ultimately, Microsoft SharePoint facilitates data analysis and sharing between teams and external users in a seamless fashion.
With its robust feature set, user-friendly design, and integration with other Microsoft products, it's sure to be an invaluable asset for any business.
No matter the size of your organization or the complexity of your project, Microsoft SharePoint has you covered. Let it help you unlock new insights into your data and take your business to the next level.
“Sharepoint is a great tool to use when you have files that need to be shared amongst multiple people and will have multiple working on them at the same time. It's also great from a security standpoint to have a local version for files that cannot be stored out of the office due to confidential information on them.
The only hangup we have is editing a file locally does lock the file online which can be a hassle sometimes.” -- Nick Sarakas, IT Manager at JCI Non-Profit Management, via Capterra
“It's quite a frustrating tool but it has a few features that are necessary. It seems like there would be something a lot better out there but I wouldn't know. There were glitches occasionally that messed up a file and we couldn't figure out which version was the "right" version.
Over time we learned to work around the glitches and learned to just think like SharePoint does to stay one step ahead of it but it took a lot of important files getting destroyed before we learned it’s little moods.” -- Andi Graham, Contractor at Critter Care Pet Relief LLC, via Capterra
#10 Clear Analytics
![]()
(Source)
Want to avoid the IT specialist bottleneck? Clear Analytics puts an Excel-based data analytics solution in the hands of your team. Users can analyze data easily, create reports, and share visualizations seamlessly - all from customize dashboards. Key data sets get transferred in real-time and are ready to understand on the fly. Manipulate data, drop and drag reports, and share KPIs amongst your business easier than ever before.
With Clear Analytics, you can take your data analysis game to the next level without having to hire extra IT staff! Take control of your analytics today and see what Clear Analytics can do for you.
“Although it lacks some of the visualizations of other softwares, Clear Analytics does a phenomenal job of what a BI software should do, provide data in a usable format, and it does it at an unbelievable price point.” -- Patrick, Security Lock & Key Inc, via SoftwareAdvice.com
See Your Way With Business Intelligence
If you’ve been putting off a business intelligence solution, you know the frustration that comes from trying to manage an infinitude of data without help. If you’re unsatisfied with your business intelligence platform, the business intelligence software mentioned today will provide true data clarity.
Utilize these user testimonials when choosing your solution, as the down-to-earth information we’ve seen today was cultivated to clear a path through the distractions in the space.
Ultimately, find a solution with a rich set of features such as robust reporting, key integrations, collaboration tools, customizable dashboards, file sync, rapid export, administrative controls, and SQL queries. But first of all, make these functions will work specifically with your business.
Your BI solution should help you find valuable insights from your data. So you’re not left out in the cold.